01 / CLIENT OVERVIEW
The business behind the brief.
Anonymised US telecom business. Client identities are anonymised in the existing project summaries.
02 / BUSINESS CHALLENGES
The challenge.
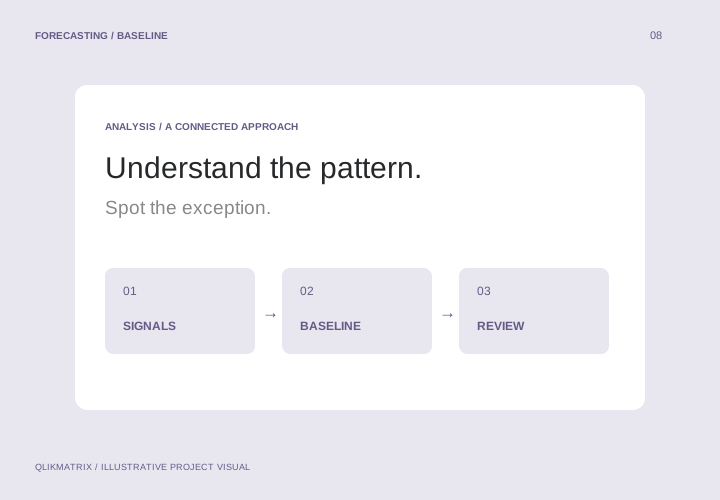
The business needed a traffic baseline to distinguish expected patterns from exceptions.
03 / GOALS AND OBJECTIVES
What success needed to look like.
Create a validated weekly forecast and allocate it into a useful daily baseline.
04 / STRATEGY AND APPROACH
The thinking behind the work.
Use ARIMA_PLUS in BigQuery with historical traffic, Search Group spend and adjusted TV signals.
05 / SERVICES PROVIDED
The connected capabilities.
Website and Traffic Analytics, Data-Driven Growth Strategies.
06 / EXECUTION AND IMPLEMENTATION
How the work came together.
Validated the model over 10 held-out weeks. Weekly forecasts were allocated using usual daily traffic shares. A consent-rate input was later added to account for measured traffic changes.
07 / RESULTS AND KEY PERFORMANCE METRICS
What the evidence shows.
The selected Search Group plus adjusted TV model recorded 3.53% mean absolute percentage error across 10 held-out weeks. This is validation performance and does not guarantee future accuracy.
08 / FINAL OUTCOME
What the work made possible.
The forecast provided a baseline for daily anomaly review, with adjustments when consent changes affected counted sessions.
Project details are based on the existing QlikMatrix website. No additional client identities, financial outcomes or implementation details have been inferred. Visuals are illustrative.