01 / CLIENT OVERVIEW
The business behind the brief.
Anonymised US telecom business. Client identities are anonymised in the existing project summaries.
02 / BUSINESS CHALLENGES
The challenge.
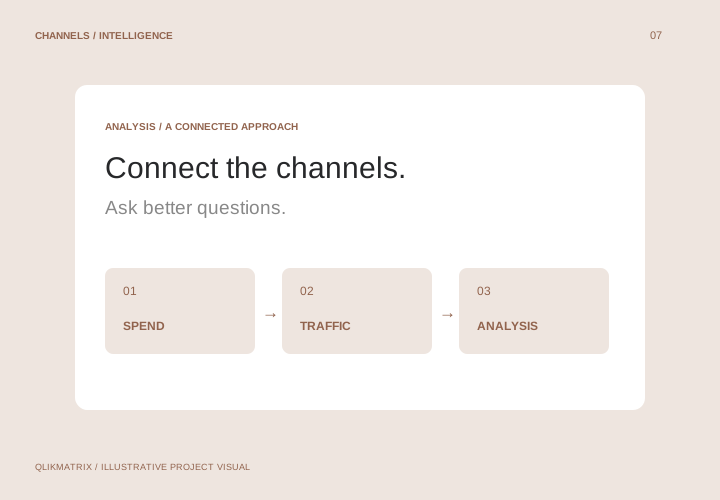
The business needed to understand how spend and website visits varied across 17 channels.
03 / GOALS AND OBJECTIVES
What success needed to look like.
Identify channel relationships worth testing and improve the questions used in budget discussions.
04 / STRATEGY AND APPROACH
The thinking behind the work.
Compare weekly spend with visits at channel and sub-channel level, while keeping correlation distinct from causation.
05 / SERVICES PROVIDED
The connected capabilities.
Marketing Performance Analysis, Data-Driven Growth Strategies.
06 / EXECUTION AND IMPLEMENTATION
How the work came together.
Analysed 115 weeks of data. Shopping / PMAX / Demand Gen showed the strongest positive association among the displayed channels, followed by TV and Display.
07 / RESULTS AND KEY PERFORMANCE METRICS
What the evidence shows.
Reported associations with visits were +0.448 for Shopping / PMAX / Demand Gen, +0.302 for TV and +0.275 for Display. Correlation does not establish incremental impact, and shared spend patterns can confound the results.
08 / FINAL OUTCOME
What the work made possible.
The analysis supported further Search Group testing and clearer evaluation of TV awareness and non-branded search efficiency.
Project details are based on the existing QlikMatrix website. No additional client identities, financial outcomes or implementation details have been inferred. Visuals are illustrative.